When a Plesk server is under a DDoS attack, the first visible symptom may be high load, slow hosted websites, exhausted PHP workers or a panel that barely responds. Those symptoms do not tell you whether the server is facing an HTTP request flood, authentication abuse, one badly behaving application or a network attack that must be filtered upstream.
The fastest safe response is to identify the exhausted resource and the targeted subscription before changing firewall rules. Plesk provides domain-specific nginx and Apache logs that make this possible, but only if you preserve the evidence and examine the correct request path.
This guide explains how to diagnose and stop a DDoS attack on a Plesk server without treating every traffic spike as malicious. It also explains how BashEdge Plesk security and DDoS protection uses Lockdown Mode and Emergency Mode during active application-layer incidents.
Perform these checks only on infrastructure you are authorized to administer. Plesk logs contain customer domains, visitor addresses and request data. Keep the original output private and remove identifying information from reports shared outside the incident team.
Identify the Attack Layer Before Blocking Traffic
A Plesk server can fail at several points in the request path. The correct mitigation depends on where capacity is being lost.
| Current evidence | Probable cause | Appropriate first action |
|---|---|---|
| nginx, Apache or PHP is busy and one subscription receives a sharp request increase | Application-layer HTTP flood | Find the targeted URL and challenge or filter the abusive request pattern |
| Websites, Plesk and SSH are unreachable while the network link is saturated | Network or transport flood | Escalate to the provider for filtering before traffic reaches the server |
| Plesk or SSH shows repeated failed authentication from one or more addresses | Brute-force attack | Review Plesk login protection and Fail2Ban jails |
| One PHP-FPM pool or database workload is busy without a matching traffic surge | Application performance problem | Diagnose the subscription and application instead of declaring a DDoS attack |
This classification prevents two common mistakes. The first is trying to fix a saturated provider link with local firewall rules. The traffic has already consumed the connection by the time the server sees it. The second is relying on a login protection tool to stop a distributed flood of valid HTTP requests.
Plesk documents Fail2Ban as an IP-based control that reads service logs and bans addresses after defined events, commonly authentication failures or known attack patterns. It is valuable for brute-force protection, but its IP-based design should not be confused with complete DDoS mitigation. The official Plesk Fail2Ban documentation explains its scope and limitations.
Record the Plesk Server State Before Restarting Anything
If the server is still accessible, capture a short operational snapshot:
date -u
uptime
nproc
vmstat 1 8
free -m
ss -s
ps -eo pid,user,comm,%cpu,%mem,stat,etime --sort=-%cpu | head -25
These commands establish the time, CPU count, load trend, memory state, connection totals and busiest processes. Save the output privately so that you can compare it with the server after mitigation.
Look for combinations rather than one alarming value:
- High nginx connection activity with growing PHP or Apache use can indicate expensive dynamic requests.
- High PHP-FPM activity under one system user often points to one Plesk subscription.
- A busy database can be the result of repeated uncached application requests.
- High system CPU can accompany packet filtering and large connection churn.
- A falling 1 minute load with higher 5 and 15 minute averages can mean the flood is already easing.
- An idle operating system with an unreachable public address can mean the bottleneck is upstream.
Restarting nginx, Apache or PHP may temporarily release workers, but the incoming requests can exhaust them again within seconds. A restart is an operational action, not a DDoS mitigation.
Find the Targeted Plesk Subscription
Plesk for Linux normally places domain logs under /var/www/vhosts/system/<domain>/logs/. The Plesk virtual host documentation describes this directory structure.
The useful files depend on the Web server path:
proxy_access_logandproxy_access_ssl_logrecord requests handled by the nginx proxy.access_logandaccess_ssl_logrecord requests handled by Apache.error_logcontains Apache errors for the domain.proxy_error_logcontains nginx errors where that log is enabled.
Plesk also exposes these sources under Websites & Domains, select the domain, then Logs. Its domain log browser documentation identifies the nginx and Apache log types available in the panel.
Rank recently active proxy logs
On the common nginx-to-Apache configuration, the proxy access log is a useful starting point because nginx receives the public request first. This command ranks logs by entries from the current minute:
minute=$(date '+%d/%b/%Y:%H:%M')
find /var/www/vhosts/system -path '*/logs/proxy_access*_log' -type f -print0 \
  | xargs -0 -I{} sh -c 'count=$(grep -c "'"$minute"'" "{}" 2>/dev/null); [ "$count" -gt 0 ] && printf "%8d %s\n" "$count" "{}"' \
  | sort -nr \
  | head -20
If nginx proxying is disabled for the affected site, repeat the check against access_log and access_ssl_log. Do not add proxy and Apache counts together. The same request may appear at both stages of the Plesk request path.
Keep the output private because each path contains a real subscription domain.
Read the HTTP Flood Pattern, Not Just the Top IP
Once you know the affected subscription, choose the active log. The following examples use the HTTPS nginx proxy log:
LOG=/var/www/vhosts/system/example.com/logs/proxy_access_ssl_logRank the most frequent source addresses in a recent sample:
tail -n 20000 "$LOG" \
  | awk '{print $1}' \
  | sort | uniq -c | sort -nr | head -20
Rank request methods and paths:
tail -n 20000 "$LOG" \
  | awk -F'"' '{print $2}' \
  | awk '{print $1, $2}' \
  | sort | uniq -c | sort -nr | head -30
Count response status codes:
tail -n 20000 "$LOG" \
  | awk '{print $9}' \
  | sort | uniq -c | sort -nr
The strongest evidence is usually a combination of source behavior, target path and server impact. Examples include:
- Thousands of requests to one dynamic search, login or API path
- Many changing addresses making the same expensive request
- Repeated WordPress XML-RPC or login traffic
- Large numbers of application-generated 404 responses
- A sudden rise in 499, 502, 503 or 504 responses
- Short connections arriving faster than workers can complete them
- A request increase that matches one busy PHP-FPM pool
Do not automatically block every address near the top of the list. A proxy, mobile carrier, office gateway or legitimate crawler can concentrate normal traffic. If an upstream proxy is in use, verify that the log contains the trusted visitor address rather than the proxy address before taking action.
Distributed application attacks often keep every individual source below a simple per-IP threshold. In that case, the shared request path, timing and behavior are more useful than the highest address count.
Check nginx, Apache and PHP-FPM Together
Plesk commonly places nginx in front of Apache. Static files may be served by nginx, while dynamic requests continue to Apache or PHP. Plesk's Apache with nginx documentation explains this request flow.
Check which layer is accumulating work:
ps -C nginx -o pid,ppid,%cpu,%mem,stat,etime,cmd --sort=-%cpu | head -20
ps -C apache2 -C httpd -o pid,ppid,%cpu,%mem,stat,etime,cmd --sort=-%cpu | head -20
ps -C php-fpm -o pid,ppid,user,%cpu,%mem,stat,etime,cmd --sort=-%cpu | head -30
Service names and process titles vary by operating system and PHP handler. Use the results to answer practical questions:
- Is nginx accepting traffic while Apache has no free workers?
- Is one PHP-FPM user repeatedly at the top?
- Are static requests creating connection pressure without PHP activity?
- Did error responses rise only after PHP workers were exhausted?
- Is the database busy because one application path is being repeated?
This prevents a server-wide restart when only one subscription needs containment. It also helps separate an attack from a legitimate site that needs caching, query optimization or more appropriate PHP-FPM limits.
Apply the Narrowest Effective Mitigation
Containment should reduce hostile work while preserving legitimate access. Start with the control closest to the actual bottleneck.
Escalate network saturation upstream
If the public interface or provider connection is full, contact the network provider immediately. Supply the start time, destination, affected protocol and any traffic summary available from the server or provider portal. Local controls cannot restore capacity already consumed before traffic reaches the machine.
For public websites behind an upstream proxy or filtering service, confirm that attackers cannot bypass it by connecting directly to the origin. Old DNS history, direct service records and application configuration can expose the server address.
Use Plesk ModSecurity for identifiable application attacks
Plesk can run ModSecurity at server and domain level. It supports Detection only mode for observing matches before enforcement and On mode for performing the configured action. Plesk warns that restrictive rule sets need testing and tuning because false positives can break valid application functions. See the official Plesk ModSecurity documentation.
ModSecurity is useful when requests match a malicious application pattern. It is less effective when a flood consists of technically valid requests to an expensive page and the distinguishing feature is rate, coordination or repeated behavior.
Use Fail2Ban for the events it can identify safely
Fail2Ban is useful for repeated authentication failures and well-defined log patterns tied to a source address. Review the active jail, filter, threshold and ban duration before making it more aggressive. Strict global settings can block legitimate users and still miss a distributed HTTP flood that rotates through many addresses.
Avoid permanent mass bans created from one short sample. Temporary rules with a recorded owner, reason and expiry time are safer to review and reverse.
Use BashEdge Lockdown Mode or Emergency Mode
BashEdge is built by our BashPilot team as a native security extension for Plesk. It adds application-aware request analysis, a Web Application Firewall, server firewall controls, intrusion prevention and Layer 7 DDoS protection without requiring each subscription owner to configure a separate service.
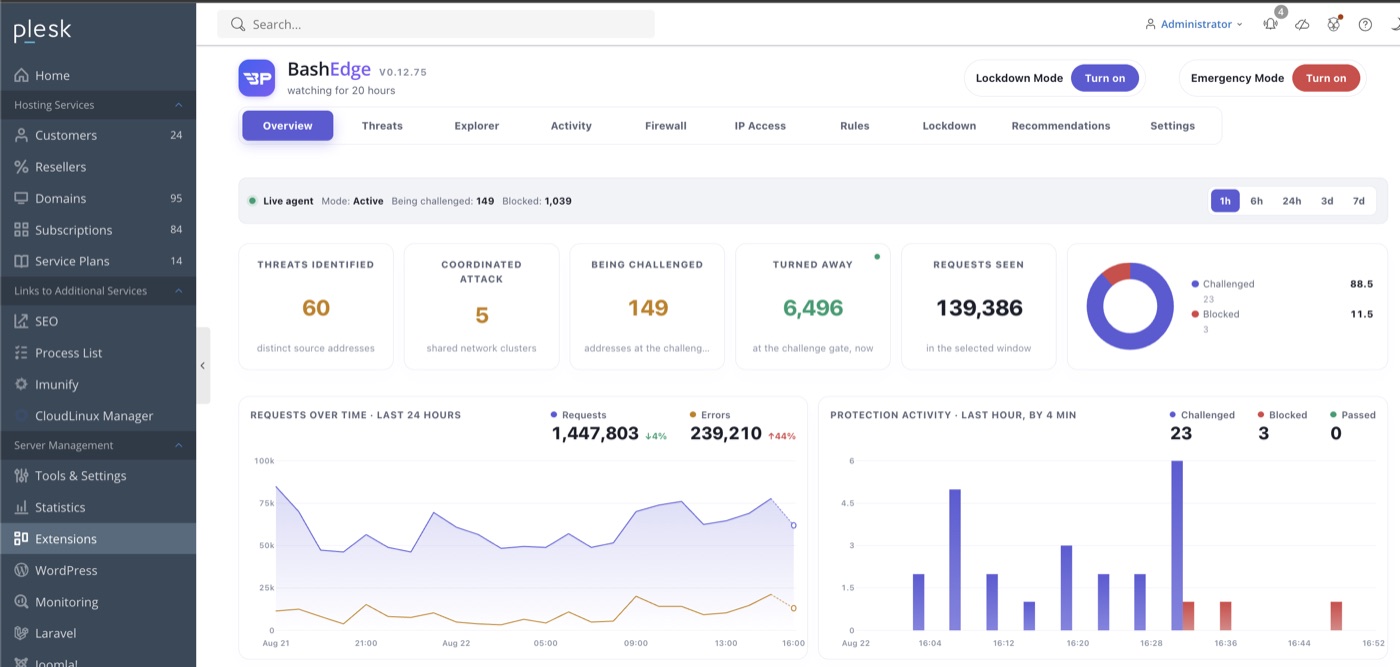
The dashboard above is a real Plesk BashEdge incident view without a customer domain or server address. In the selected view, BashEdge has observed 139,386 requests, identified 60 threat sources and 5 coordinated network clusters, challenged 149 addresses and turned away 6,496 requests. The request and protection charts show the incident trend directly inside Plesk.
The two incident controls serve different situations.
Lockdown Mode performs deeper connection analysis
Lockdown Mode is the controlled response when an HTTP flood is active but the administrator still wants selective visitor access. BashEdge analyzes each new connection and its request behavior in greater detail, then verifies traffic before allowing it to consume the hosted application.
Use Lockdown Mode when:
- One Plesk subscription is receiving a distributed request flood.
- Source addresses rotate too quickly for simple IP bans.
- The server is reachable and there is still enough capacity to analyze requests.
- Legitimate browsers, verified crawlers and allowlisted services must continue.
- You need visibility into which connections are passed, challenged or blocked.
The protection can be scoped to the targeted domain or extended across hosted subscriptions when the incident affects the shared Web server. Monitor the challenge rate, passed traffic and application errors after activation.
Emergency Mode contains a severe server-wide incident
Emergency Mode is intended for a severe application-layer DDoS attack that is threatening the stability of the Plesk server. It applies a more aggressive containment posture when preserving Web server capacity is the immediate priority.
Use Emergency Mode when:
- Several subscriptions or the shared request path are becoming unavailable.
- Worker exhaustion returns immediately after normal mitigation.
- The request rate is rising faster than selective controls can contain it.
- The server is still receiving traffic, but its remaining capacity is at risk.
Because Emergency Mode is deliberately aggressive, enable it as an incident control, watch legitimate traffic closely and reduce the protection level once the server is stable. Record the activation time and the recovery evidence so the decision can be reviewed later.
Neither mode replaces provider-level filtering if a volumetric attack has saturated the network before requests reach Plesk. In that case, engage the provider first. BashEdge protects the application request path that the server can still inspect.
Learn more about BashEdge Plesk security and DDoS protection, including the native Plesk extension, application-aware rules and server-wide threat visibility.
Verify That the Plesk Server Has Recovered
Repeat the initial snapshot after applying the mitigation:
date -u
uptime
vmstat 1 8
ss -s
ps -eo pid,user,comm,%cpu,%mem,stat,etime --sort=-%cpu | head -25
Then inspect a fresh sample of the affected domain log:
tail -n 5000 "$LOG" \
  | awk '{print $9}' \
  | sort | uniq -c | sort -nr
Confirm the full recovery rather than relying on a lower load number:
- The 1 minute load and run queue are falling.
- nginx and Apache can accept normal requests.
- PHP-FPM workers are no longer accumulating for the affected subscription.
- Connection totals remain stable after temporary rules expire.
- 5xx responses return to the site's normal range.
- A legitimate visitor can complete important application actions.
- Plesk remains responsive and background services are healthy.
The longer load averages decay slowly, so the 5 and 15 minute values can remain high after current pressure has ended. Fresh traffic, worker and response data are more useful for confirming immediate recovery.
Continue monitoring after the first improvement. An attack can return on another path, switch domains or resume when a temporary control expires.
Prepare the Plesk Server Before the Next Attack
A practical response plan reduces both downtime and risky decisions. Prepare the following while the server is healthy:
- Provider escalation contacts and the evidence they require
- Alerts for abnormal request rate, connection growth, worker exhaustion and repeated 5xx responses
- A documented method for mapping Plesk load to a subscription and log file
- Tested ModSecurity rules with known exclusions recorded
- Fail2Ban jails reviewed for authentication services and false-positive risk
- An upstream filtering plan for network and transport attacks
- BashEdge monitor data reviewed before activating enforcement
- Lockdown Mode scope and allowlists agreed in advance
- Emergency Mode activation and rollback responsibility assigned
- A private incident timeline that records every change and its result
Protect the origin address where the service design permits it. Review direct DNS records, mail hostnames and application integrations that may bypass the expected HTTP request path.
If the Plesk server hosts unrelated customer subscriptions, test changes against more than the attacked site. A rule designed for one application can interrupt another site's API, payment callback, webhook, monitoring check or administrative login.
When Plesk Server Management Is Needed
Bring in an experienced Plesk administrator when the target is unclear, the server is repeatedly exhausting workers, several subscriptions are affected or the mitigation could interrupt production customers.
A useful response should identify the attacked subscription and request pattern, distinguish application traffic from network saturation, coordinate upstream filtering when required, apply reversible controls and verify that normal users still succeed.
iServerSupport provides Plesk server management for servers you already own or rent. We do not sell hosting servers. Our engineers manage Plesk configuration, nginx and Apache behavior, performance, security hardening, monitoring and incident response. For an active outage, use our emergency server support. For preventive protection, see our server security service.
Plesk DDoS Questions
Can Plesk stop every DDoS attack?
No. Plesk provides logs, ModSecurity, Fail2Ban and administration controls that support investigation and mitigation, but network saturation must be filtered upstream. Application-layer floods can often be contained with request-aware controls while the server remains reachable.
Does Fail2Ban stop a distributed HTTP flood?
Not reliably. Fail2Ban is strongest when a defined log event repeats from the same address. A distributed flood can rotate addresses or keep each source below a simple threshold. Use request behavior, coordination and target information rather than depending only on IP counts.
What is the difference between Lockdown Mode and Emergency Mode?
Lockdown Mode performs deeper analysis and visitor verification so legitimate traffic can continue during an active HTTP flood. Emergency Mode uses a more aggressive containment posture when a severe application-layer attack threatens the stability of the whole server. Keep it under close observation, then return to standard protection once capacity and normal traffic are stable.
Should I restart nginx or Apache during the attack?
Restart only when it is operationally necessary. Capture current evidence first when possible. A restart may release workers, but the same request flood can exhaust them again unless you control the incoming pattern.
Can BashEdge stop an attack that saturates the provider link?
No server-side product can recover a network connection that is already full before traffic reaches the server. Provider-level filtering is required in that situation. BashEdge controls application-layer requests that reach the Plesk server and can still be analyzed.
Get hands-on support for your Plesk server
We maintain and troubleshoot Plesk servers across websites, mail, databases, security and system services.